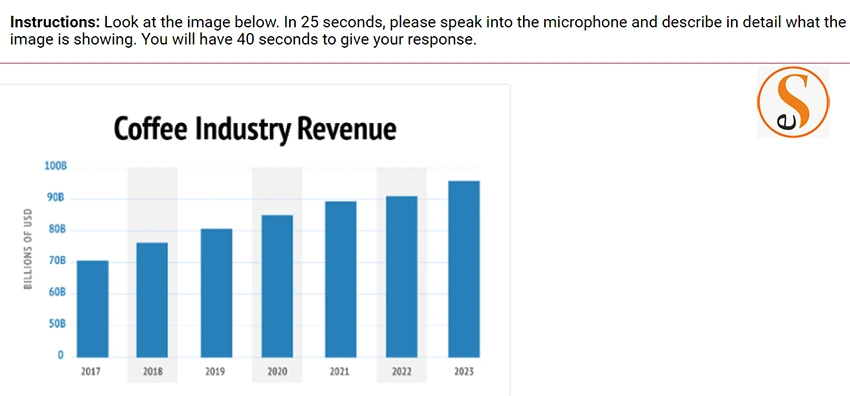
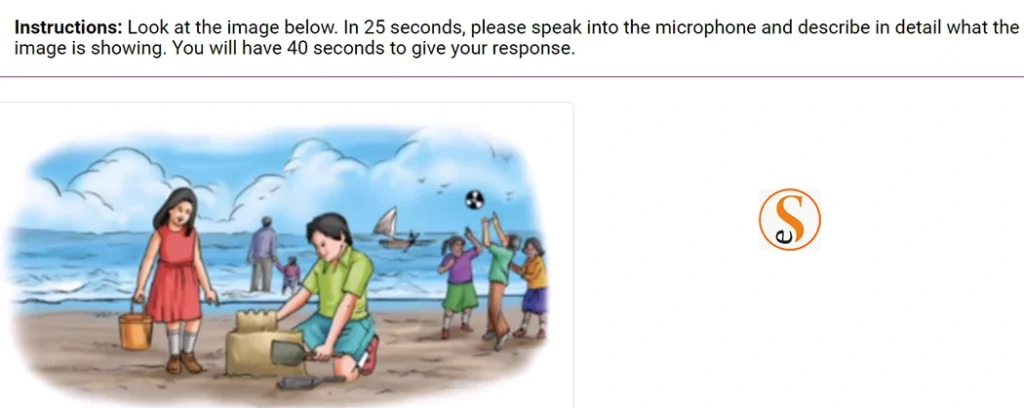
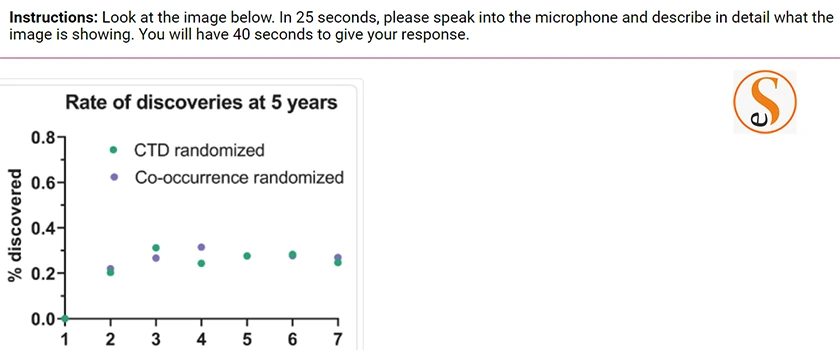
The Describe Image task is a part of the speaking section in the Pearson Test of English (PTE) exam, which is designed to assess the speaking and listening skills of non-native English speakers. In this task, test-takers are presented with an image, such as a graph, chart, map, or diagram, and are required to describe the information presented in the image in a short period of time. The task is designed to evaluate the test-taker’s ability to speak fluently, coherently, and accurately in English.
Table of Contents
Types of Images in Describe Image Task
The images presented in the Describe Image task can be of various types, including line graphs, bar charts, pie charts, maps, tables, and diagrams. Test-takers may be presented with one or more images and are required to describe the information presented in each image in a response of 40 seconds. The number of images and questions can vary, but typically, there are between 5 to 6 images that need to be described.
Templates to Help Maximize Score for Describe Image task
Here is a template that you can use to help you structure your response for the Describe Image task:
Template 1:
- Introduction: Introduce the image by mentioning the type of image and the topic it relates to.
- Overview: Provide a brief overview of the main trends or patterns that the image shows.
- Details: Describe the details of the image, including specific data points or information that support the trends or patterns mentioned in the overview.
- Conclusion: Summarize the information presented in the image and make any relevant observations or conclusions.
Example:
Here is an example response using the template:

Image type: Line graph
Topic: Sales trends for a retail store.
Introduction: This is a line graph that shows the sales trends for a retail store over the past year.
Overview: Overall, the graph shows that there has been a gradual increase in sales throughout the year, with a slight dip in sales in the month of August.
Details: In January, the store made $10,000 in sales, which steadily increased to $20,000 in May. Sales then dipped in August to $15,000 but quickly rebounded to $25,000 in September. In October, sales hit a high point of $30,000 before leveling off to $25,000 in December.
Conclusion: In summary, the graph shows a consistent increase in sales for the store over the course of the year, with a slight dip in August. The highest sales were achieved in October, and sales remained strong through December.
Template 2:
This image shows a [type of chart] which presents data on [subject of the chart].
According to the chart, [main point 1].
Additionally, [main point 2].
Overall, the chart highlights [overall conclusion].
You can fill in the blanks with specific information as per the image. For example, if the image is a line graph showing the population growth of a city, the template can be filled in as follows:
This image shows a line graph which presents data on the population growth of a city. According to the graph, the population has been steadily increasing over the past 10 years. Additionally, there was a sharp increase in population in the last 2 years. Overall, the graph highlights the significant growth of the city’s population in recent years.
By using a template like this, you can easily organize your thoughts and provide a clear and concise response for the PTE Describe Image task.
PTE Describe Image Practice: Test Your Skills with Sample Images
Are you preparing for the PTE Describe Image question type? To help you get ready, we’ve compiled a selection of sample images for you to practice describing. These images cover a range of topics and feature different types of graphs, charts, maps, and diagrams commonly seen on the PTE test. Use them to hone your skills in analyzing and describing visual information under timed conditions, and to get a feel for the type of language and vocabulary you’ll need to use in your responses. With regular practice, you’ll be well on your way to acing the PTE Describe Image section!


Tips to maximize your score in the Describe Image task
- Read the instructions carefully: Make sure you understand the task requirements and the number of points that you need to cover in your response.
- Analyze the image: Take some time to carefully examine the image and identify the key features, patterns, and trends that it shows.
- Use appropriate vocabulary: Use relevant and appropriate vocabulary to describe the image accurately and effectively. You can also use synonyms or related words to add variety to your language.
- Organize your response: Organize your response logically and coherently. Use appropriate linking words and phrases to connect your ideas and create a cohesive description.
- Pay attention to grammar and sentence structure: Use correct grammar and sentence structure to convey your ideas clearly and accurately. Avoid making common grammatical errors and try to use a variety of sentence structures to showcase your language skills.
- Practice, practice, practice: The more you practice describing different types of images, the more comfortable and confident you will become in doing so. Try to practice with a variety of images and use the template provided earlier as a guide to help you structure your response.
- Manage your time: Make sure you allocate your time effectively to cover all the points required in the response. You can use the time to carefully examine the image, plan your response, and organize your thoughts before starting to speak.
Common mistakes to avoid when answering the Describe Image task
- Focusing too much on irrelevant details: Make sure you focus on the key features, patterns, and trends that the image shows. Avoid getting bogged down in irrelevant details that don’t contribute to your overall description.
- Making assumptions: Stick to the information that the image provides and avoid making assumptions or speculations about the subject matter. Your response should be based solely on what you can see in the image.
- Omitting important details: Make sure you cover all the important points required in the task instructions. If you leave out any key details or fail to cover all the points required, you may lose points on your overall score.
- Being too brief or too verbose: Avoid being too brief or too verbose in your response. Try to strike a balance between providing enough information to fully describe the image and being concise and to the point.
- Not organizing your response: Organize your response logically and coherently, using appropriate linking words and phrases to connect your ideas. Failing to do so may result in a disjointed or confusing response.
- Neglecting grammar and sentence structure: Use correct grammar and sentence structure to convey your ideas clearly and accurately. Avoid making common grammatical errors and try to use a variety of sentence structures to showcase your language skills.
- Misinterpreting the image: Make sure you accurately interpret the image and its contents. Misinterpreting the image may result in an inaccurate or irrelevant response.
Wrap Up
The Describe Image task can be a challenging part of the PTE exam, but with the right preparation and practice, you can master this task and score high. By following the tips provided in this guide and avoiding common mistakes, you can improve your performance and achieve your desired score.

